- Global commodity production, logistics, and demand jointly drive market prices, but climate variability – particularly weather anomalies – is driving increasing disruptions across agriculture, energy, and industrial sectors.
- Sub-seasonal and seasonal forecasting, along with teleconnection patterns, provide early, actionable signals that influence market expectations and forward curves.
- Weather regimes strongly affect European power and gas markets by altering temperature, wind, hydrology, and renewable output.
- Alternative data sources – such as satellites, AIS shipping flows, and real-time system data – enhance early detection of climate-driven risks.
- Traders and risk managers integrate these signals through scenario modelling, weather-indexed derivatives, and climate-informed volatility pricing.
Climate Signals in Commodity Systems: Why Weather Moves Markets
In recent years, a spate of weather shocks[1] has emphasised how commodity markets are dynamically bound to the planet’s physical systems.
El Niño, for instance, is a natural climate pattern where the Pacific Ocean gets warmer than usual, causing changes in weather worldwide. The 2023-2024 El Niño event brought simultaneous drought in South-east Asia, record heat across Central America and Brazil, and flooding in East Africa – disrupting global flows of coffee[2], cocoa[3], rice[4].
These episodes highlight a core reality: commodity markets are highly weather-sensitive, and for some ‘soft’ commodities (i.e. crops), the supply of outputs is simply weather-dependent over the growing season. For some others (i.e. energy), the demand for end-consumption for adaptation is deeply tied to weather shocks, whether it is increased use of electricity (for cooling) or natural gas (for heating). In addition, as the energy transition accelerates, cities and supply chains are implementing electrification strategies. This creates a new form of dependence on climate-sensitive energy systems.
Global commodity production, logistics, and demand jointly shape price formation. Ultimately, shocks to food and energy commodities remain the major transmission channel for inflation (Kilian, 2008).
Commodity markets rely on standardised exchange-traded contracts, each tied to a delivery month, quality, and location, that let participants trade future obligations instead of physical goods. This structure enables a transparent price system in which spot prices (i.e. present prices) reflect immediate supply–demand conditions, while prices of futures capture expectations for later delivery. The set of futures across maturities forms the forward curve. This latter shifts between contango, where future prices sit above spot because storage, financing, and other carrying costs push deferred prices higher, and backwardation, where scarce inventories and strong near-term demand make spot prices higher than futures. Seasonal patterns such as harvest cycles, summer or winter energy demand, along with infrastructure constraints and regional imbalances, shape the curve’s slope and introduce proxies of predictable location-specific prices.
Traders use these structural relationships to trade spreads (i.e. the price difference between related contracts across different expiration, location, or correlated commodities). Ultimately, what structures all pricing is the evolving supply–demand balance, influenced by production, logistics, weather, macroeconomic trends, and substitution between inputs. Future prices include a risk premium, which represents the compensation that speculators receive for absorbing the hedging pressure coming from producers and end-users.
Commodities are singular among asset classes in that their prices are bounded by physical production constraints, harvest cycles, storage, and transport infrastructure. Financial markets, recognizing this, increasingly price meteorological information as a form of tradable risk. Lemoine and Kapnick (2024) showed that US options markets explicitly adjust volatility around official El Niño and winter outlooks, implying that reliable weather forecast is itself financially valued because absorbed by options markets. Hydrological variability affects hydroelectric output and power prices (Emre, 2025); persistent heat or cold anomalies alter energy load and fuel spreads (Goutham, 2022); and large-scale climate circulation anomalies, influence power markets and investment flows by altering energy prices, production costs, and inflation dynamics (Wang et al., 2025).
Advances in sub-seasonal to seasonal (S2S) forecasts which cover a time horizon from weeks to months (Nicholas, 2025) have improved our understanding of how weather anomalies propagate through agricultural yields, hydrological inflows, and energy balances. These forecasting tools, supported by multimodal datasets (satellite imagery, shipping data etc.) provide a conceptual foundation for assessing how information about the climate system is absorbed by financial markets.
From Weather Regimes to Price Regimes
Forecasting the Atmosphere: From Hours to Seasons
Weather forecasting spans a hierarchy of temporal and spatial scales, each governed by different physical dynamics and predictive tools.
At the shortest horizon, hours to days, numerical weather prediction models assimilate satellite, in-situ and radar observations to forecast temperature, precipitation, and wind with high accuracy. These forecasts drive short-term electricity production and demand, transportation logistics, and intraday commodity trading.
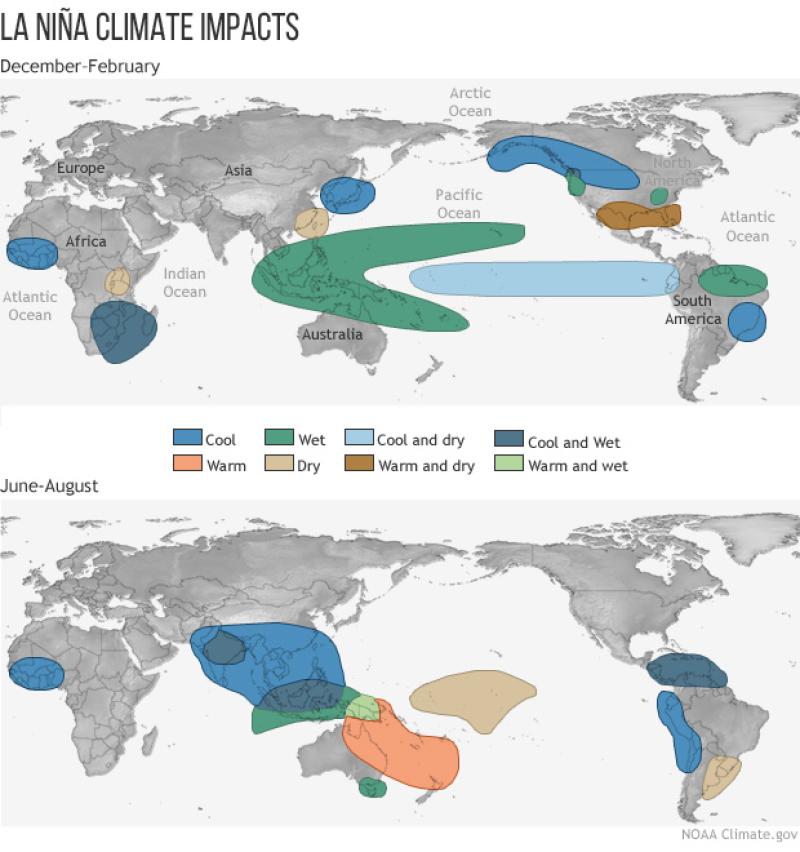
Beyond two weeks, deterministic skill decays and prediction shift toward a probabilistic framework referred to as S2S forecasting. S2S forecasts (covering two to six weeks) use ensemble models and statistical adjustments to capture slower climate patterns. Seasonal forecasts (one to six months) integrate coupled ocean–atmosphere models to capture large-scale anomalies driven by phenomena such as El Niño (see Figure 1).
Figure 1: Illustration of El Niño climate impact
Notes: From © NOAA/Climate.gov[5].
Weather Regimes and Teleconnections
At seasonal scales, the climate system organizes into quasi-stationary weather regimes, recurring patterns of atmospheric circulation that modulate temperature and precipitation over vast areas. These regimes form the physical backbone of teleconnections.
Teleconnections matter because they are predictable drivers of local climate anomalies. For instance, a positive Indian Ocean Dipole (IOD) typically suppresses rainfall in Australia and boosts it in East Africa, reshaping global wheat and coffee supply chains. Using the seasonal forecast systems, teleconnection indices can be predicted and then combined with observed teleconnection-surface relationships to generate probabilistic seasonal outlooks for European temperature, wind and solar radiation relevant to the energy sector (Cionni et al., 2022).
Several large-scale climate regimes play crucial roles in shaping global commodity and energy markets. The El Niño–Southern Oscillation (ENSO), encompassing both El Niño and La Niña phases, arises from oscillations in Pacific sea surface temperatures that alter global atmospheric convection patterns. These shifts influence agricultural yields, particularly soy, coffee, and rice.
The IOD operates through changes in the sea surface temperature gradient across the Indian Ocean, which in turn modulates monsoon rainfall. When the onset of seasonal rains is disrupted or postponed, it can lead to significant agricultural and logistical impacts. In South and East Asia, such breakdowns result in impact on wheat, palm oil, and coffee – as well as coal transport bottlenecks.
Transmission Mechanisms to Markets
Weather anomalies transmit into commodity markets through many interconnected channels, principally supply, demand, and logistics, each impacting the equilibrium between physical and financial layers of the market. Supply shocks arise when extreme meteorological events directly disrupt production processes through reduced output, particularly from shocks to production factors, whether resource inputs, capital formation, or simply labour availability.
Prices are the key endogenous variables of both supply and demand. A primary identification challenge for economists is to quantify supply and demand elasticities, given that unobserved shifts in supply and demand affect prices through the equilibrium condition. The literature (Schlenker and Roberts, 2008; Roberts and Schlenker, 2013) has shown that weather-induced yield shocks (deviations from the mean attributable to random weather fluctuations) can significantly help to address this challenge.
For instance, droughts not only reduce crop yields but also curtail hydroelectric generation and commercial river transportation (through reduced navigability since low water levels limit the draft of vessels), while excessive rainfall or floods impede mining operations and terrestrial transportation networks. Over the course of a year, hurricanes and cyclones frequently damage offshore oil platforms, pipelines, and refining capacity, resulting in temporary production shut-offs for maintenance purpose scaling up into supply implications.
Storage and Logistic
Storage is a characteristic feature of commodity markets[6]. As a result, equilibrium is defined by the prices and quantities where supply equals demand plus the net change in storage. It is a dynamic and forward-looking decision that is endogenously determined by: (i) the optimality condition equating the marginal cost of carrying inventory today to the expected marginal benefit of holding it for future periods, which necessarily includes (ii) expectations about future prices, and (iii) considerations of weather-related impacts on supply and demand.
Geman (2005) provided general principles on the theory of storage: physical disruptions elevate the convenience yield, the implicit value of holding inventories. As a result, spot prices rise faster than future prices, creating a steeper forward curve. In other words, the market starts paying an extra “scarcity premium” for immediate supply because commodities available now are: (i) harder to find, and therefore (ii) more valued in the present than those only accessible at a future period.
First, in storable commodity markets, supply (directly influenced by the climate itself) and demand elasticities (shaped by consumer preferences and prices) jointly determine optimal storage behaviour[7]. Second, in the context of our changing climate, weather shocks generate fluctuations in commodity production that storage helps to buffer, thereby dampening short-term spikes in spot prices.
Logistical and storage activities stand in between supply and demand. When impacted by weather events, they transmit and magnify both supply and demand shocks because they directly reduce the market’s ability to move physical commodities in surplus and / or compensate for shortages. Taking the example of river transport disruptions, historically low water levels in the Rhine (Ademmer et al., 2023) or Mississippi (Chen and Cheng, 2024) reduce barge capacity for coal, grains, and refined products, creating regional shortages and surpluses that widen local price spreads. These bottlenecks increase carrying costs by slowing transport and raising storage expenses, which takes the form of a productivity shock in the transport sector. As a result, the usual arbitrage relationship between spot and futures prices becomes weaker (Peterson, 2018). When storage facilities are near capacity or restricted by regulation, excess supply cannot be easily held back (storage incurs a cost per ton per day, reflecting the expenses of warehousing, insurance, and capital tied up in the stored goods; notwithstanding perishable commodities), causing sharper spot-price swings: prices fall in regions where commodities accumulate but cannot be moved, while rising in regions where disrupted transport limits deliveries. In short, when transportation or storage cannot function effectively, even modest disruptions lead to disproportionately larger price movements because the market loses its ability to dynamically balance the persisting gap between supply and demand.
Demand
Demand-side shifts are most obvious in energy systems, where outdoor temperature shocks modify the consumption of energy for indoor adaptation purposes. Heating degree days (HDD) and cooling degree days (CDD)[8], capture these deviations: cold winters intensify demand for natural gas, coal, and heating oil, while heatwaves surge electricity used for cooling. Note that this is ultimately determined by the share of energy sources in the overall supply-mix of the economy of interest.
In sum, the path from climate anomaly to market pricing is nonlinear and modulated by the characteristics of production, consumption, storage and logistical systems. The interplay of physical constraints, storage economics, and anticipatory trading approaches transform meteorological information into price signals. These capture the market implications of weather events, and, more broadly, how commodity markets dynamically manage risks.
Weather-Regime Impacts on European Commodities: Practical Illustration Using ECMWF Probabilistic Forecasts
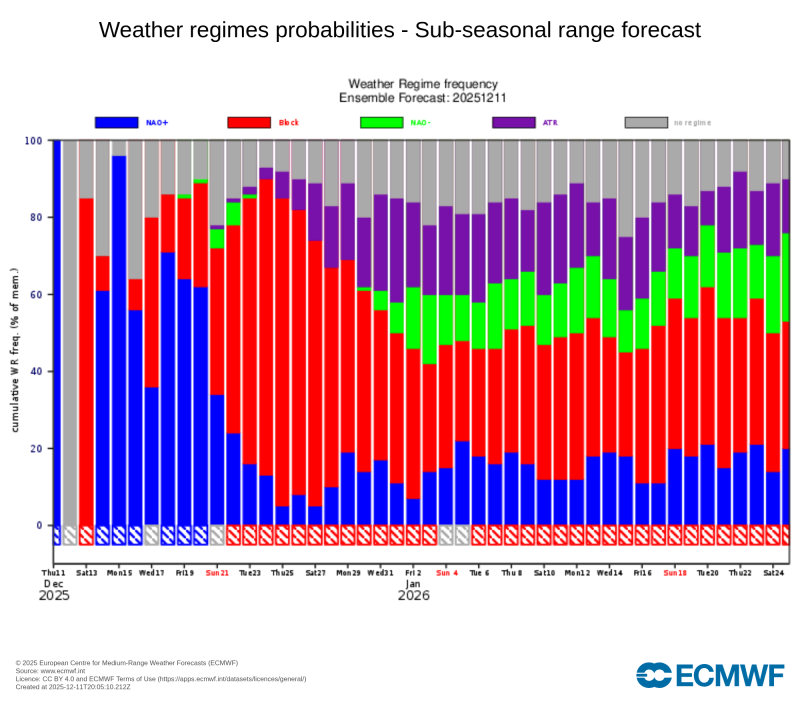
ECMWF, for example, provide six-week-period probabilistic forecasts of four Europe dominant weather regimes. Each daily update assigns a probability to states such as negative and positive North Atlantic Oscillation (NAO+ and NAO-), European or Scandinavian Blocking (Block), Atlantic Ridge (ATR), and shows how these probabilities evolve over the coming weeks. These regime shifts often anticipate market-moving conditions long before local weather signals appear (see Figures 2 and 3).
Figure 2: ECMWF weather regimes probabilities forecast
Notes: Data from December 7, 2025 © ECMWF[9].
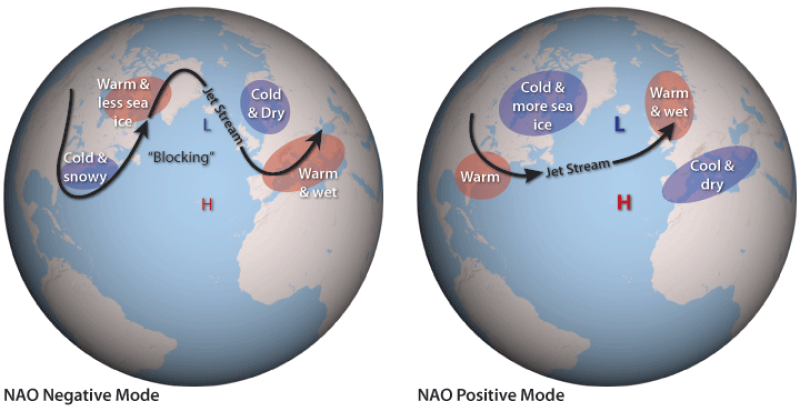
Figure 3: Illustration of the North Atlantic oscillation
Notes: From © NOAA/Climate.gov[10].
This framework is particularly powerful in the European power sector, where regime-driven combinations of temperature, wind availability, and cloud cover determine the supply–demand balance. A strong NAO+ signal in ECMWF’s winter outlook typically indicates higher temperature over North and Central Europe (Scaife and Knight., 2008) and higher wind in Northern Europe (Cionni et al., 2022). Southern Europe is more likely to see cold, dry winter conditions but with higher surface solar radiation (Cionni et al., 2022) a pattern raising wind power generation and reducing heating demand. Hydropower systems across Scandinavia and Alpine regions are favoured by this weather regime, which boosts inflows and reservoir stocks. Nordic system prices tended to soften as water availability increased. Meanwhile, Southern Europe often faces drier conditions under the same regime, tightening hydro balances in Italy or Spain.
Agricultural markets also exhibit clear responses to regime dynamics, even though the price effects are often slower to materialize. NAO+ sequences affect maize, soybean, and wheat, while simultaneously imposing drought stress across Mediterranean regions (Zellou et al., 2023). Blocking regimes, particularly when they emerge late in winter or early spring, raise the likelihood of frost events and cold snaps (Brunner et al., 2017) damaging vineyards, or apple and pears orchards (Unterberger et al., 2018; Sgubin et al., 2018).
Industrial commodities and logistics chains react to weather-regime-driven disruptions. NAO+ regimes amplify storminess in the North Atlantic (Pinto et al., 2009), delaying port operations, impacting shipping schedules, and occasionally tightening physical availability of metals. It may not alter global price benchmarks directly but influence regional premia, freight costs, and delivery differentials, which are the price adjustments applied to a commodity depending on where and how it is delivered.
An increasing probability of negative NAO in winter, characterised by persistent high pressure, reduced westerlies, and cold continental air, acts as an early indicator of suppressed wind output and elevated residual load, often associated with so-called “dunkelflaute” events (Mockert et al., 2023). This leads to simultaneously lower wind/solar generation and higher demand (especially heating) and can trigger higher prices on electricity and related energy source prices such as gas. Natural gas markets respond even more directly to regime signals, as temperature deviations translate into immediate heating-demand shifts and influence the merit order between renewables and thermal generation.
Trading and Risk Management Applications
Scenario Modelling
Weather events can quickly change the value and risk of a commodity portfolio. Running weather-based stress tests helps traders see how extreme conditions might affect profits and losses.
For example, a “cold Dunkelflaute” can push up power and gas prices while cutting renewable output. Simulating this type of event in a Value-at-Risk (VaR) model (quantifying the distribution of portfolio losses controlling for correlated spikes in energy prices and drops in renewable generation) helps a utility or hedge fund understand how much the portfolio could lose if similar conditions return.
Another tool is conditional correlation analysis, which basically[11] shows how links between commodities change under stress. In a heatwave, for instance, higher gas demand for power generation can drive gas and electricity prices to move more closely together than usual. Recognizing these shifts helps traders adjust hedge ratios or spreads in advance.
Option and Derivative Pricing
Climate uncertainty has also accelerated the use of customized weather-indexed derivatives (Shylov, 2023; Janda & Vyležík, 2011). Temperature-linked swaps hedge deviations in heating or cooling demand, while rainfall or hydrology options protect hydropower operators from low-inflow periods (Foster et al. 2015). As renewable penetration grows, the dependence of load, generation, and grid stability on meteorological variables makes weather-index hedging an essential component of risk management. This logic extends into capital markets through index-triggered climate catastrophe bonds (Ando et al., 2022; Götze and Gürtler, 2022), where payouts occur when extreme events exceed predefined thresholds. These instruments allow insurers, utilities, and energy producers to transfer high-severity climate risks to investors, while investors gain access to exposures largely uncorrelated with traditional financial markets.
Traditional econometric models, more advanced machine learning or deep learning models can be used to estimate the impact of weather variables on prices. Gas prices forecast models usually integrate temperature information (Berrisch and Ziel, 2022; Su et al., 2019). Meanwhile, agriculture price forecast models integrate more complex weather factors (Gaffoor and Assa, 2025; Goswami and Karali, 2025; Sun et al., 2023).
Integrating Alternative Data
To enhance situational awareness, alternative datasets extend the reach of conventional forecasts. High-resolution satellite imagery detects crop vigour and thermal anomalies weeks before official reports; for example, NDVI satellite-based vegetation signals accurately anticipated the 2023 Argentine soybean yield shortfall[12].
Shipping-lane AIS data (e.g., VesselFinder) highlight congestion or weather-driven rerouting, such as during storms or low river levels. Refinery-outage reports provide complementary detail on capacity reductions at oil refineries and the resulting logistical constraints during extreme weather. Similar real-time visibility is available for aviation flows (Flightradar24), electricity systems (ElectricityMaps), and cross-border power exchanges (ENTSO-E Transparency Platform).
Conclusion
Markets increasingly respond to atmospheric signals with greater speed and precision. Advances in sub-seasonal and seasonal forecasting, combined with a growing understanding of teleconnections and weather-regime dynamics, allow traders, utilities, and policymakers to anticipate shifts in temperature, wind, rainfall, and hydrology that materially reshape production, demand, and logistics. These probabilistic climate signals feed directly into how commodity pricing captures environmental variability. At the same time, the emergence of alternative data, satellite imagery, AIS tracking, real-time load and generation data, has expanded the toolkit for detecting stress in global supply networks.
While weather is a central force shaping commodity markets, increasingly granular and high-resolution data now allow us to capture this relationship more accurately. Yet beyond the identifiable shocks that drive short-run volatility lies a quieter, structural shift. Climate change is gradually altering the baseline of local climate conditions: what once counted as “normal” is drifting, and yield patterns can shift simply because the underlying distribution of temperature and precipitation is moving. As the IPCC underscores, shifting means also bring a higher frequency of extremes, amplifying risks if agricultural and energy systems fail to adapt. These realities call for a new generation of dynamic commodity models, ones capable of capturing both the acute impacts of weather variability and the subtle, accumulating effects of a changing climate baseline. Only then will we fully be able to grasp the magnitude of weather’s evolving imprint on commodity markets.
Footnotes
[1] Beyond natural climate patterns, human-driven climate change and the long-term warming caused by fossil fuel emissions are shifting the distribution of extreme weather events (e.g., heat, drought, precipitation), making them increasingly frequent and intense over time (Lobell et al., 2011). Given the explicit objective of this article, this topic is excluded here.
[6] This naturally excludes non-storable (or minimally storable) commodity markets; i.e., commodities that cannot be economically stored, have extremely high storage costs, or physically perish/decay too fast to be held as inventories like electricity (particularly renewable power generation), fresh dairy and fruits, and live cattle.
[7] When supply is relatively inelastic (the quantity supplied responds weakly to changes in price), production shocks (such as weather-induced yield fluctuations) can trigger large price swings, giving agents strong incentives to store surplus output during abundant harvests to stabilize future prices. When supply is more elastic (the quantity supplied responds strongly to price changes, but not necessarily infinitely), production adjusts more easily to weather shocks, reducing price volatility and the need for large inventories.
[8] HDD and CDD are climatological metrics defined as the cumulative sum, over a period, of the differences between a reference base temperature Tbase (often 18ºC ~ 65ºF) and the daily mean outdoor temperature Tmean whenever Tmean Tbase (for CDD). In sum, HDD and CDD quantifies the temperature-induced energy demand for space adaptation heating and cooling, respectively.
[11] More precisely, conditional correlations quantify how the co-movement between asset or commodity returns varies as a function of market states, capturing the strengthening or weakening of dependencies during periods of elevated volatility.
References
Ademmer, M., Jannsen, N., & Meuchelböck, S. (2023). Extreme weather events and economic activity: The case of low water levels on the Rhine river. German Economic Review, 24(2), 121-144.
Ando, S., Fu, C., Roch, F., & Wiriadinata, U. (2022). Sovereign climate debt instruments: An overview of the green and catastrophe bond markets. Washington, DC: International Monetary Fund.
Berrisch, J., & Ziel, F. (2022). Distributional modeling and forecasting of natural gas prices. Journal of Forecasting, 41(6), 1065-1086. https://doi.org/10.1002/for.2853
Brunner, L., Hegerl, G. C., & Steiner, A. K. (2017). Connecting atmospheric blocking to European temperature extremes in spring. Journal of Climate, 30(2), 585-594. https://doi.org/10.1175/JCLI-D-16-0518.1
Chen, Z., & Cheng, J. (2024). Economic consequences of inland waterway disruptions in the Upper Mississippi River region in a changing climate. The Annals of Regional Science, 73(2), 757-794. https://doi.org/10.1007/s00168-024-01283-0
Cionni, I., Lledó, L., Torralba, V., & Dell’Aquila, A. (2022). Seasonal predictions of energy-relevant climate variables through Euro-Atlantic teleconnections. Climate Services, 26, 100294. https://doi.org/10.1016/j.cliser.2022.100294
Emre, T. (2025). The influence of hydroelectric power generation and water level variability on market clearing prices: A case study of Türkiye. International Journal of Electrical Power & Energy Systems, 170, 11086. https://doi.org/10.1016/j.ijepes.2025.110865
Foster, B. T., Kern, J. D., & Characklis, G. W. (2015). Mitigating hydrologic financial risk in hydropower generation using index-based financial instruments. Water Resources and Economics, 10, 45-67. https://doi.org/10.1016/j.wre.2015.04.001
Gaffoor, M., & Assa, H. (2025). Examining the Impact of Weather Factors on Agricultural Market Price Risk: An XAI Approach. In Quantitative Risk Management in Agricultural Business (pp. 249-272). Cham: Springer Nature Switzerland. https://doi.org/10.1007/978-3-031-80574-5_10
Geman, H. (2005). Commodities and commodity derivatives: modeling and pricing for agriculturals, metals and energy. John Wiley & Sons.
Goswami, A., & Karali, B. (2025). Effects of growing-season weather on the dynamic price relationships between biofuel feedstocks. Energy Economics, 108581. https://doi.org/10.1016/j.eneco.2025.108581
Götze, T., & Gürtler, M. (2022). Risk transfer beyond reinsurance: the added value of CAT bonds. The Geneva Papers on Risk and Insurance-Issues and Practice, 47(1), 125-171.
Goutham, N. (2022). Sub-seasonal meteorological predictions for the European energy sector: Quantitative assessment, improvement, and application (Doctoral dissertation, Institut Polytechnique de Paris).5. https://www.theses.fr/2022IPPAX125
Janda, K., & Vylezik, T. (2011). Financial Management of Weather Risk with Energy Derivatives. https://mpra.ub.uni-muenchen.de/35037/
Kilian, L. (2008). The economic effects of energy price shocks. Journal of economic literature, 46(4), 871-909.
Lemoine, D., & Kapnick, S. (2024). Financial markets value skillful forecasts of seasonal climate. Nature Communications, 15(1), 4059. https://doi.org/10.1038/s41467-024-48420-z
Lobell, D. B., Schlenker, W., & Costa-Roberts, J. (2011). Climate trends and global crop production since 1980. Science, 333(6042), 616-620.
Mockert, F., Grams, C. M., Brown, T., & Neumann, F. (2023). Meteorological conditions during periods of low wind speed and insolation in Germany: The role of weather regimes. Meteorological Applications, 30(4), e2141. https://doi.org/10.1002/met.2141
Nicholas, W. (2025). A Review of Cross-Domain Time-Series Forecasting in Agriculture. Authorea Preprints. https://doi.org/10.36227/techrxiv.175979344.40663594/v1
Peterson, P. E. (2018). Commodity derivatives: A guide for future practitioners. Routledge.
Pinto, J. G., Zacharias, S., Fink, A. H., Leckebusch, G. C., & Ulbrich, U. (2009). Factors contributing to the development of extreme North Atlantic cyclones and their relationship with the NAO. Climate dynamics, 32(5), 711-737. https://doi.org/10.1007/s00382-008-0396-4
Roberts, M. J., & Schlenker, W. (2013). Identifying supply and demand elasticities of agricultural commodities: Implications for the US ethanol mandate. American Economic Review, 103(6), 2265-2295.
Scaife, A. A., & Knight, J. R. (2008). Ensemble simulations of the cold European winter of 2005‐2006. Quarterly Journal of the Royal Meteorological Society, 134(636), 1647-1659. https://doi.org/10.1002/qj.312
Schlenker, W., & Roberts, M. J. (2008). Estimating the impact of climate change on crop yields: The importance of nonlinear temperature effects (No. w13799). National Bureau of Economic Research.
Sgubin, G., Swingedouw, D., Dayon, G., de Cortázar-Atauri, I. G., Ollat, N., Pagé, C., & van Leeuwen, C. (2018). The risk of tardive frost damage in French vineyards in a changing climate. Agricultural and Forest Meteorology, 250, 226-242. https://doi.org/10.1016/j.agrformet.2017.12.253
Shylov, M. (2023). Weather derivatives: general overview, legal, tax, and application issues. Journal of Management and Financial Sciences, (49), 53-72. https://doi.org/10.33119/JMFS.2023.49.3
Su, M., Zhang, Z., Zhu, Y., & Zha, D. (2019). Data-driven natural gas spot price forecasting with least squares regression boosting algorithm. Energies, 12(6), 1094. https://doi.org/10.3390/en12061094
Sun, F., Meng, X., Zhang, Y., Wang, Y., Jiang, H., & Liu, P. (2023). Agricultural product price forecasting methods: A review. Agriculture, 13(9), 1671. https://doi.org/10.3390/agriculture13091671
Unterberger, C., Brunner, L., Nabernegg, S., Steininger, K. W., Steiner, A. K., Stabentheiner, E., ... & Truhetz, H. (2018). Spring frost risk for regional apple production under a warmer climate. PloS one, 13(7), e0200201. https://doi.org/10.1371/journal.pone.0200201
Wang, W., Xie, H., Yang, Z., Song, Z., & Chen, W. (2025). The Demand and Challenges of Meteorological Services for Power Systems Amid Global Climate Change. IET Smart Energy Systems, 1(2), 156-167. https://doi.org/10.1049/ses2.70011
Zellou, B., El Moçayd, N., & Bergou, E. H. (2023). Towards improved drought prediction in the Mediterranean region–modeling approaches and future directions. Natural Hazards and Earth System Sciences, 23(11), 3543-3583. https://doi.org/10.5194/nhess-23-3543-2023