By Nicolas Schneider, Senior Research Engineer-Macroeconomist at EDHEC Climate Institute and Alice James, Writer, EDHEC Climate Institute
Introduction
The actuarial lens offers a stark perspective on the stakes of physical climate risk, noting that if you were tasked with underwriting possible losses, you’d certainly focus on tail risks. A University of Exeter report[1] starts from a simple but fundamental question: “What scenarios could drive societal and economic ruin?”. This rightly argues that analyses should work backwards from extreme outcomes, focusing first on high-damage, low-probability scenarios, before gradually moving away from the tails.
Next, when evaluating climate-related economic impacts, tail risks are often embedded into local projections. We must identify these tail risks at the local level[2], before they are smoothed out by global averages. Although commonly used to convey damage estimates broadly, aggregate metrics compress spatial variability and sacrifice accuracy. Yet, most of our perception of climate-related damages is inherently and inevitably local.
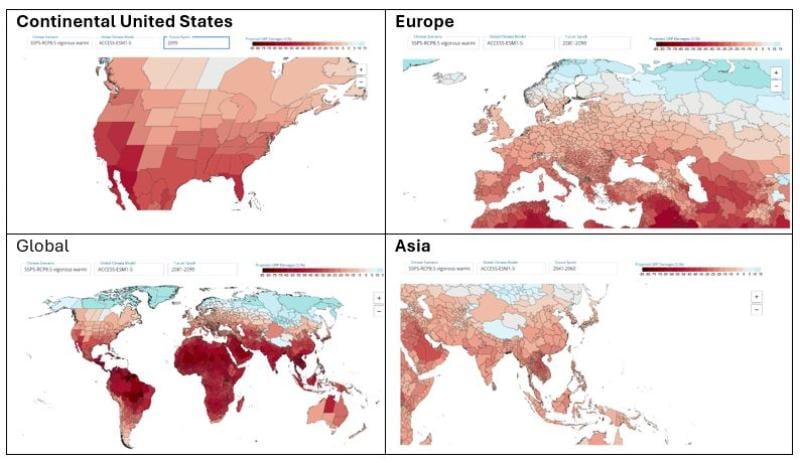
EDHEC-CLIRMAP contributes to this effort. This article focuses on three major regions (North America, Europe, and Asia) and explores the story revealed by this interactive online tool within each. It then concludes by providing an overview of the aggregated, resulting, global picture, and why it is mired in uncertainty.
EDHEC-CLIRMAP
But before we start, let’s recall what EDHEC-CLIRMAP is and what it is not.
The EDHEC-CLIRMAP (EDHEC-CLimate-Induced Regional MAcroimpacts Projector) is a web-hosted tool developed by the EDHEC Climate Institute. It offers an intuitive platform for scientists, experts, professional investors and policymakers to explore how climate change-induced temperature variations impact gross regional product (GRP) across a range of reference temperature models and scenarios. The geographic coverage of this product is global and contains highly-spatially disaggregated information on 3,672 sub-national administrative provinces.
The user can configure a choice of: (i) future epoch (e.g., 2050); (ii) benchmark climate scenario (e.g., such as the SSP-RCP climate scenarios from IPCC); and (iii) global climate model (e.g., ACCESS-ESM1-5, CESM2-WACCM, …, MPI-ESM1-2-HR).
EDHEC-CLIRMAP will then offer a spatial visualisation of what the climatically induced change in GRP is expected to be. By zooming in on the map, the user can point to specific areas of the world (e.g., the Provence-Alpes Cote d’Azur region in France, the Lombardia in Italy, or Chaiyaphum in Thailand) and obtain summary statistics of expected climate change impacts on regional economic output.
EDHEC-CLIRMAP is a scenario-based tool and does not provide real-time updates or adjust its estimates in response to weather alerts, forecasts, or observed events. To the reader, we recommend companion technical documents (EDHEC-CLIRMAP–The Macroeconomic and Econometric Background, EDHEC-CLIRMAP—A High-Level Note, EDHEC-CLIRMAP—The How-to-Guide). For the remainder of the article, the GCM reference point used is ACCESS-ESM1-5[3].
North America: Modest National Losses, Extreme Regional Hotspots
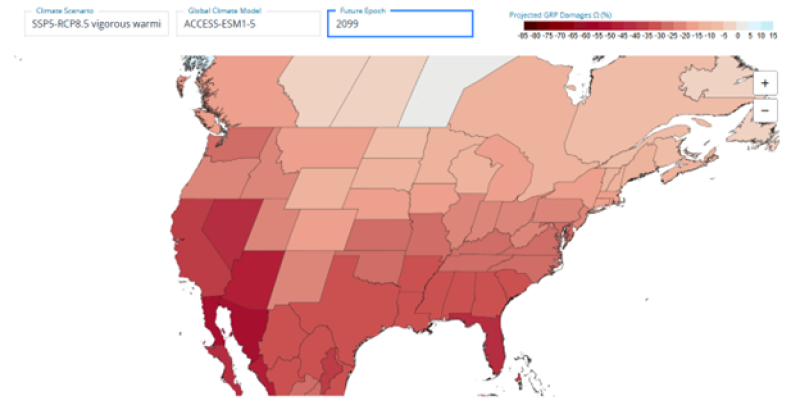
EDHEC-CLIRMAP scenario-based projected US damage estimates appear to be consistent with the scientific and policy literature on US climate-related economic impacts. Under the SSP2–RCP4.5 moderate scenario, EDHEC-CLIRMAP projects end-century state-level damages ranging from 1% of GDP in Oregon to 29% in Florida. Under the more vigorous SSP5–RCP8.5 scenario at mid-century, projected impacts range from around –1% in Maine to –13% in Texas and –19% in Arizona. These wide gradients reflect the United States’ exceptional geographic and climatic diversity (from humid subtropical regions to arid high-desert zones) and its concentration of economic activity in distinct regional clusters such as the Bay Area, New York City, and the Northeast corridor. Said otherwise, zonal impacts are to be expected.
US central official baselines, such as those produced by the Congressional Budget Office (CBO), generally place national-level end-century GDP losses in the single-digit range. Yet scientific literature underscores that uncertainty remains substantial. Mohaddes and Raissi (2025)[4] and the CBO[5] outline plausible outcomes spanning roughly +6% gains to –21% losses by 2100. This suggests that climate change may create both net-gainer and net-loser states in absolute terms, consistent with the heterogeneous US state-level predictions provided in EDHEC-CLIRMAP.
This heterogeneity is strongly visible in states like Florida, which faces some of the most acute economic climate risks in the country. Rising sea levels, intensifying hurricanes, and extreme heat threaten property markets, tourism, tax bases, and insurance affordability. NOAA-based projections[6] indicate that sea level rise along Florida’s coastline is outpacing the global mean, reaching an estimated 16 to 23 inches by 2050 and 2 to 10 feet by 2100. Even a four-foot rise would permanently inundate roughly 2,400 square miles of land[7]. Despite this, recent peer-reviewed local estimates of GDP-quantified regional damages remain surprisingly limited[8], reinforcing the value of tools like EDHEC-CLIRMAP (cf. Exhibit 1) for placing local impacts in an economic context.
In California, the economic implications of physical risks cannot go without mentioning wildfires, drought, extreme heat, and coastal flooding. A 2014 Risky Business report[9] on the economic risks of climate change in the US already highlighted that annual damage in severe years already may exceed several billion, particularly when large wildfire seasons coincide with drought conditions. Recent empirical work highlights the scale of these effects: Li & Yu (2025) found that exposing 1% of a county’s population to wildfire reduces annual GDP by 1.2%[10], while Wang et al. (2020)[11] estimate that observed wildfires alone reduced California’s GDP by 1.5% for the fiscal year of 2018. These findings align with EDHEC-CLIRMAP’s portrayal of California as a high-risk, high-loss state under both moderate and vigorous warming scenarios.
Exhibit 1: Continental United States on EDHEC-CLIRMAP, epoch is end-century (2099), scenario is SSP5-RCP8.5.
Source: Our elaboration at EDHEC Climate Institute.
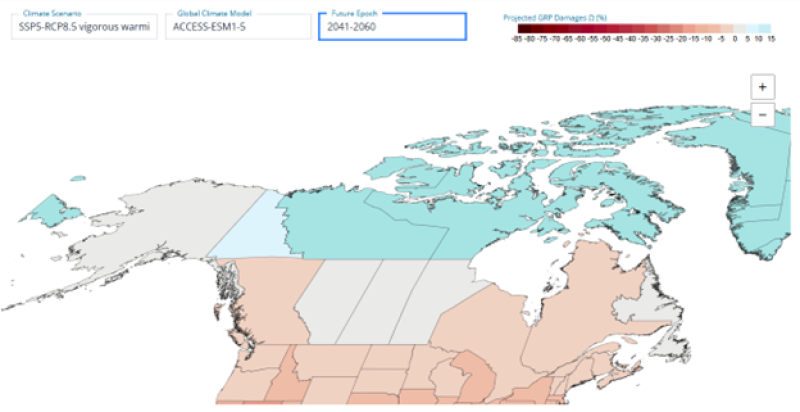
As a high-latitude economy, Canada’s historical average temperature is below the global mean. Consequently, projected economic impacts from climate change-induced temperature increases are smaller than in lower-latitude countries, but remain non-negligible. Yet climate-driven economic impacts remain significant and highly uneven across provinces and territories. EDHEC-CLIRMAP results illustrate this heterogeneity clearly. Under the SSP2–RCP4.5 moderate scenario, and more strikingly under the vigorous SSP5–RCP8.5 scenario at mid-century, provincial impacts range from about 15% losses in the Northwest Territories and 5% in the Yukon to far milder outcomes in the southern provinces, including approximately –2% in British Columbia, +0.97% in Alberta, and –4.4% in Ontario. By end-century, projected losses deepen in exposed regions: British Columbia’s impacts reach –18%, driven by mounting wildfire damages, declining snowpack, and water-stress-related pressures on hydropower and agriculture.
National-level assessments broadly align with these patterns. Canada is typically characterised as a mid-range risk country in global climate-economy studies although the aggregate loss remains meaningful. The Parliamentary Budget Officer projects real GDP to be 5.8% lower by 2100 relative to a stable-climate baseline[12]. The Canadian Climate Institute argues that climate change has already eroded about half of recent GDP growth, reflecting rising disaster costs, productivity losses from heat, and infrastructure stress[13]. International assessments underscore this vulnerability: the G20 Climate Risk Atlas estimates losses of 4.4% of GDP by 2050 and 13.1% by 2100 under a high-emissions trajectory[14], falling to roughly 4.8% by 2100 if warming is limited to around 2°C (showing substantial benefits to mitigation).
Within this national picture, Quebec stands out. Stan et al. (2021)[15] identify it as one of the least economically stressed regions in long-run modelling, projecting a 3–4% GDP increase over roughly 70 years as longer growing seasons open new agricultural opportunities and prospects for global food supply[16]. Quebec’s near-100% renewable electricity system also enhances resilience by insulating households and industries from fossil-fuel-linked shocks. Nonetheless, complementary research stresses that this positive outlook is not uniform: gains are region-specific, dependent on adaptive capacity, and accompanied by rising risks from extreme precipitation, river flooding, and ecosystem shifts.
Canada’s high latitude offers prospects for resilience but not immunity. Projected national-level losses are moderate relative to global estimates, yet specific regions exhibit pronounced vulnerabilities, with limited zones indicating potential economic gains, consistent with EDHEC-CLIRMAP simulations (cf. Exhibit 2).
Exhibit 2: Canada on EDHEC-CLIRMAP, epoch is mid-century (2041-2060), scenario is SSP5-RCP8.5.
Source: Our elaboration at EDHEC Climate Institute.
Europe: Uneven Exposure, Dense Coastal Development, and Elevated Risk
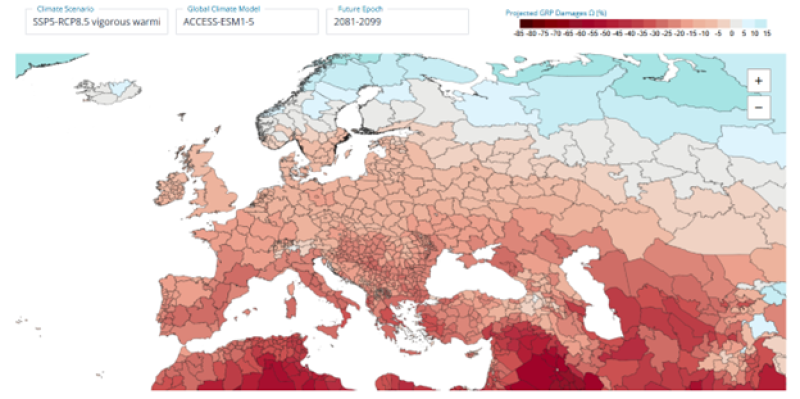
Europe’s administrative regions provide a higher spatial granularity that is valuable for investors seeking regional insights. Under a vigorous SSP5–RCP8.5 scenario at mid-century, EDHEC-CLIRMAP (cf. Exhibit 3) projects impacts ranging from modest gains to severe losses: +9% in Norrbotten (Sweden), +4% in Oppland (Norway), –4% in Drenthe (Netherlands), –5% in Podlaskie (Poland), –6% in Sachsen-Anhalt (Germany), –7% in Auvergne-Rhône-Alpes (France), –9% in Lombardia (Italy), and –15% in Calabria (Italy). By the end of the century, projected losses deepen dramatically, reaching –33% in Thessaly (Greece), –32% in Lazio (Italy), –30% in Castilla-La Mancha (Spain) and Portalegre (Portugal), and –26% in Provence-Alpes-Côte d’Azur (France).
These spatially resolved projections align broadly with sectoral and national-level studies. The European Environment Agency (2025)’s overall estimates climate change-driven GDP losses of 7% by 2100[17], whereas Vousdoukas et al. (2018) project a –1% impact solely attributable to sea-level rise[18]. The annual cost of drought is likely reach €65 billion yearly[19] (including the UK). Hence, one must not overlook the compounding nature of climate hazards across Europe.
Greece faces some of the continent’s most extreme climate risks: rising temperatures, drought, wildfires, storms, and sea-level rise. The Bank of Greece, back in 2011, warned that, in the absence of global climate action, cumulative GDP losses could reach €701 billion by 2100 (equivalent to 3–4 times Greece’s 2020 GDP at constant 2008 prices) with annual GDP projected to decline by 2% by 2050 and 6% by 2100[20]. A 2024 update reinforced these concerns. Coastal regions are particularly exposed: the EU Regional Sea Level Rise Study predicts GDP impairments of 9.56–20.84%[21], with roughly one-third of the population, 80% of industrial activity, and 90% of tourism industry located in these zones.
Norway illustrates the dual nature of high-latitude impacts. Arctic amplification is expected to raise mean temperatures by 2100 even under low-emission scenarios[22]. Warmer conditions could benefit agriculture, potentially enabling two harvests per year as the growing season extends by 1–2 months. At the same time, more intense rainfall and snowmelt increase the risk of river floods, landslides, and avalanches. Historically stable or falling coastal levels due to land uplift are now projected to rise along most of the coastline. Vousdoukas et al. (2018) estimate –1.7 to –5.9% GDP losses from coastal flooding alone by 2100, Swiss Re projects –6.9% GDP by 2050 under a severe scenario[23]. NILU/NTNU (2025) report that 0.2% of GDP is currently exposed to 20-year storm events[24], while McEvoy (2021) suggests over 5% of GDP could be at risk from coastal flooding by 2100[25]. Of course, extreme climate tipping points, excluded from EDHEC-CLIRMAP, such as a potential AMOC collapse[26], could radically alter this projection.
Italy illustrates Europe’s sharp regional climate heterogeneity. Under SSP5–RCP8.5, EDHEC-CLIRMAP projects mid-century GDP impacts of –9% in Lombardia and –15% in Calabria, worsening by end-century with –32% in Lazio and –30% in southern regions such as Calabria and Sicilia. Northern regions, like Lombardia or Veneto, face heatwaves, droughts, and river floods, threatening industrial hubs and agriculture. Southern regions combine extreme heat, wildfires, and coastal flooding, with tourism-dependent economies particularly exposed.
Coastal zones are highly vulnerable: estimates exceed 3% GDP loss from sea-level rise by 2100 in coastal provinces[27], which adds up to combined flooding and erosion. G20 Climate Risk Atlas projections confirm severe end-century impacts[28], especially in Lazio, reflecting both industrial and administrative concentration. Northern Italy may gain some benefits from longer growing seasons, but these are likely outweighed by heatwaves, floods, and storms.
Italy’s varied geography, starting with the Alpine north all the way to the Apennine spine and southern coasts, creates pronounced regional differences in climate risk, necessitating localised adaptation strategies. This spans from glacier retreat, flooding, and hydropower volatility in the North (requiring water storage upgrades, flood-resilient infrastructure, and energy diversification) to chronic drought, heat stress, and desertification in the South, requiring renewable energy deployment, water-efficiency investments, and climate-resilient agriculture. For investors, this regional heterogeneity shapes both exposure and potential opportunities.
Exhibit 3: Europe on EDHEC-CLIRMAP, epoch is end-century (2081-2099), scenario is SSP5-RCP8.5.
Source: Our elaboration at EDHEC Climate Institute.
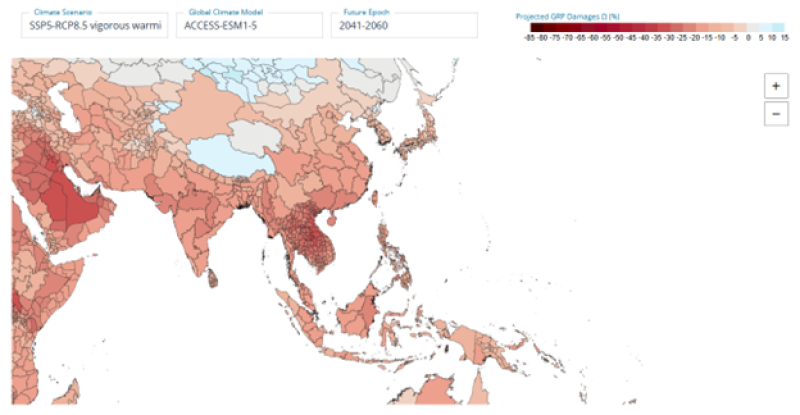
Asia: Extreme Coastal Losses, Modest Inland Gains: Asia’s Climate Divide
Asia faces a wide spectrum of climate-related economic risks, amplified by high humidity, intense monsoons, extreme storms, heatwaves, and dense coastal populations.
Under a vigorous SSP5–RCP8.5 scenario at mid-century, EDHEC-CLIRMAP projects zonal GDP impacts ranging from –31% in Khammouan (Laos) and –26% in Chaiyaphum (Thailand) to –22% in Guangdong (China), –17% in Riau (Indonesia), –16% in Isabela (Philippines), and –15% in Sarawak (Malaysia). The combination of tropical humidity, high rainfall variability, and urban concentration drives these extreme losses. In contrast, northern and inland regions, such as Dornod (Mongolia, +5%) and Amur (Russia, +6%), may see modest gains from longer growing seasons and milder temperatures. Impacts are moderate in coastal Australia (Queensland, –6%) and Singapore (–4.5%), where heat stress and sea-level rise intersect with densely-developed infrastructure. Patterns remain broadly consistent under a moderate SSP2–RCP4.5 scenario, though with lower intensity.
Regional assessments reinforce these projections. The Asian Development Bank (ADB) estimates GDP reductions around 17% by 2070, rising to 41% circa-2100 in developing Asia under high-emission scenarios[29]. The IPCC projects South Asia could lose nearly 2% of GDP by 2050, climbing to 9% by 2100 under a business-as-usual climate scenario[30]. This figure climbs up to 13% if we consider the McKinsey Report on Climate Risk and Response in Asia[31].
Singapore exemplifies this vulnerability pattern. Swiss Re identifies it as highly exposed to sea-level rise, heat stress, and tourism revenue shocks, although its adaptive capacity provides partial resilience. Under the most severe scenario, Singapore could lose 46.4% of GDP by 2050, while the broader South/Southeast Asia region could see cumulative losses exceeding seven times 2019 GDP[32]. NTU Singapore and the University of Glasgow estimate a 35% regional GDP drag by 2050[33], and government assessments suggest one-off costs of 20% of GDP for coastal defences[34]. EDHEC-CLIRMAP (cf. Exhibit 4) aligns with this conclusion.
Overall, Asia highlights extreme spatial heterogeneity in climate risk: low-latitude, humid, densely populated coastal zones face catastrophic losses, whereas inland and higher-latitude regions may realise modest gains. Investors assessing evaluating climate-exposed assets must account for this heterogeneity story.
Exhibit 4: Asia on EDHEC-CLIRMAP, epoch is mid-century (2041-2060) scenario is SSP5-RCP8.5.
Source: Our elaboration at EDHEC Climate Institute.
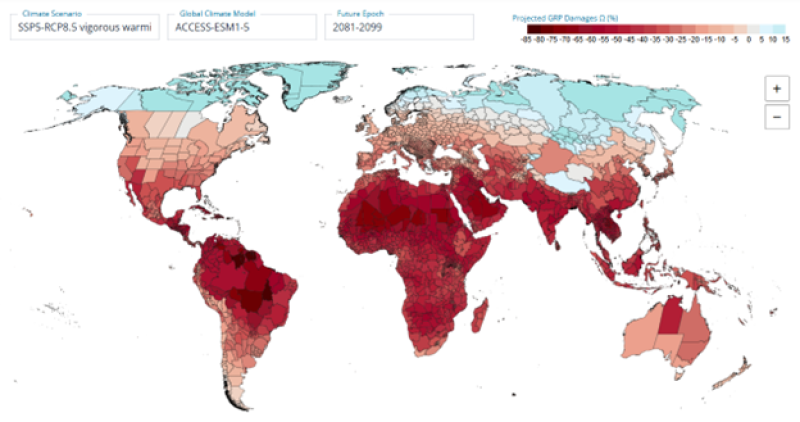
Global: Consensus on Net Losses, Uncertainty on Scale
Global economic impacts of climate change exhibit extreme variability across scenarios and methodologies.
The IMF estimates 2100 GDP losses of about 1% if Paris targets (2015) are met, rising to 7% under high-emission pathways, with a revised analysis suggesting 7–13% losses, and up to 24% GDP per capita loss under very high emissions[35][36]. NBER studies paint a far darker picture, warning of –57% losses in worst-case scenarios, while a 1°C temperature rise alone could reduce global GDP by 21%[37]. Neal et al. (2025)[38] synthesise findings from Burke et al. (2015), Kahn et al. (2021), and Kotz et al. (2024), illustrating the wide divergence of model-based outcomes: median 2100 losses range from –28% to –86% (Burke et al., 2015), –4% to –19% (Kahn et al., 2021), and –11% to –40% (Kotz et al., 2024), highlighting the profound uncertainty inherent in global climate-economy projections. Actuarial approaches, such as those from the University of Exeter mentioned above, emphasise tail risks, estimating up to 50% global GDP destruction by 2070–2090 under systemic cascades, compared with mainstream NGFS-type long-scenario expectations of 15–20% losses by 2050[39]. Overall, insurers corroborate these extremes. Swiss Re (2021), for instance, predicts –18% global GDP by 2050 under severe scenarios, with regional losses reaching 37% in ASEAN, 10% in the US, and 11% for Europe, a picture illustrated in EDHEC-CLIRMAP (cf. Exhibit 5) as well.
Across all studies, the global picture reflects significant uncertainty with a wide range of potential outcomes. While sector-specific assessments of physical climate risks do exist[40], they typically lack either global coverage, forward-looking damage projections, or both. As a result, a systematic and generalised framework (applied consistently across a wide range of sectors, beyond the most weather-dependent or intuitive ones, and typically anchored using a common Gross Value-Added metric) is still missing. This underscores the need for sectoral damage functions that generate outputs distributed consistently across both time and space. Since sector- and region-level damages aggregate to form national impacts, which in turn contribute to the global picture, this highlights the need to account for tail risks and to systematically analyse regional and intra-country projections for investment decisions. This is where EDHEC-CLIRMAP finds its contribution.
Exhibit 5: Global picture on EDHEC-CLIRMAP, epoch is end-century (2081-2099), scenario is SSP5-RCP8.5.
Source: Our elaboration at EDHEC Climate Institute.
Footnotes
[2] Dell, M., Jones, B. F., & Olken, B. A. (2014). What do we learn from the weather? The new climate-economy literature. Journal of Economic literature, 52(3), 740-798.
[3] Hausfather et al. (2022) identified the ‘hot model problem’. A subset of CMIP6 global climate models may be “too hot,” reflecting cloud feedback representations that produce a stronger-than-consensus global surface temperature response to increased atmospheric CO₂. The authors recommended to classify GCMs based on whether their ECS (equilibrium climate sensitivity) and TCR (transient climate response) values are inside or outside “likely” ranges. This filtering yields a set of 15 “likely” GCMs, in which ACCESS-ESM1-5 is present. For a deeper review of this topic, see: Hausfather, Z., Marvel, K., Schmidt, G. A., Nielsen-Gammon, J. W., & Zelinka, M. (2022). Climate simulations: recognize the ‘hot model’problem. Nature, 605(7908), 26-29.
[4] Mohaddes, K., & Raissi, M. (2025). Rising temperatures, melting incomes: Country-specific macroeconomic effects of climate scenarios. PLOS Climate, 4(9), e0000621.
[5] Shirley, C., & Swanson, W. (2025). The Effects of Climate Change on GDP in the 21st Century: Working Paper 2025-02 (No. 61186).
[11] Wang, D., Guan, D., Zhu, S., Kinnon, M. M., Geng, G., Zhang, Q., ... & Davis, S. J. (2021). Economic footprint of California wildfires in 2018. Nature Sustainability, 4(3), 252-260.
[15] Stan, K., Watt, G. A., & Sanchez-Azofeifa, A. (2021). Financial stability in response to climate change in a northern temperate economy. Nature Communications, 12(1), 7161.
[16] Unc, A., Altdorff, D., Abakumov, E., Adl, S., Baldursson, S., Bechtold, M., ... & Borchard, N. (2021). Expansion of agriculture in northern cold-climate regions: a cross-sectoral perspective on opportunities and challenges. Frontiers in Sustainable Food Systems, 5, 663448.
[18]V ousdoukas, M. I., Mentaschi, L., Voukouvalas, E., Bianchi, A., Dottori, F., & Feyen, L. (2018). Climatic and socioeconomic controls of future coastal flood risk in Europe. Nature Climate Change, 8(9), 776-780.
[19] Naumann, G., Cammalleri, C., Mentaschi, L., & Feyen, L. (2021). Increased economic drought impacts in Europe with anthropogenic warming. Nature Climate Change, 11(6), 485-491.
[21] Cortés Arbués, I., Chatzivasileiadis, T., Ivanova, O., Storm, S., Bosello, F., & Filatova, T. (2024). Distribution of economic damages due to climate-driven sea-level rise across European regions and sectors. Scientific Reports, 14(1), 126.
[22] Ono, J., Watanabe, M., Komuro, Y., Tatebe, H., & Abe, M. (2022). Enhanced Arctic warming amplification revealed in a low-emission scenario. Communications Earth & Environment, 3(1), 27.
[25] McEvoy, S., Haasnoot, M., & Biesbroek, R. (2021). How are European countries planning for sea level rise?. Ocean & Coastal Management, 203, 105512.
[27] Chatzivasileiadis, T., Arbues, I. C., Hinkel, J., Lincke, D., & Tol, R. S. (2023). Actualised and future changes in regional economic growth through sea level rise. arXiv preprint arXiv:2401.00535.
[36] Kahn, M. E., Mohaddes, K., Ng, R. N., Pesaran, M. H., Raissi, M., & Yang, J. C. (2021). Long-term macroeconomic effects of climate change: A cross-country analysis. Energy Economics, 104, 105624.
[37] Bilal, A., & Känzig, D. R. (2024). The macroeconomic impact of climate change: Global vs. local temperature (No. w32450). National Bureau of Economic Research.
[38] Neal, T., Newell, B. R., & Pitman, A. (2025). Reconsidering the macroeconomic damage of severe warming. Environmental Research Letters, 20(4), 044029.
[40] On the agriculture sector, see: Schlenker, W., & Roberts, M. J. (2009). Nonlinear temperature effects indicate severe damages to US crop yields under climate change. Proceedings of the National Academy of sciences, 106(37), 15594-15598, and Burke, M., & Emerick, K. (2016). Adaptation to climate change: Evidence from US agriculture. American Economic Journal: Economic Policy, 8(3), 106-140 for agriculture.
On the energy sector, see: Auffhammer, M., Baylis, P., & Hausman, C. H. (2017). Climate change is projected to have severe impacts on the frequency and intensity of peak electricity demand across the United States. Proceedings of the National Academy of Sciences, 114(8), 1886-1891, and Auffhammer, M. (2018). Quantifying economic damages from climate change. Journal of Economic Perspectives, 32(4), 33-52.